Annual Trends
| Annual Temperature Trend | |||
| Month | Average since 2017 | Current Month | Difference |
| January | 48.8°F | 46.7°F (2025) | 2.1°F  2.1°F colder than all-time average temperature. 2.1°F colder than all-time average temperature. |
| February | 51.0°F | 54.0°F (2025) | 3.0°F  3.0°F warmer than all-time average temperature. 3.0°F warmer than all-time average temperature. |
| March | 55.5°F | 55.9°F (2025) | 0.4°F  0.4°F warmer than all-time average temperature. 0.4°F warmer than all-time average temperature. |
| April | 63.5°F | 63.3°F (2025) | 0.2°F  0.2°F colder than all-time average temperature. 0.2°F colder than all-time average temperature. |
| May | 70.3°F | 72.1°F (2025) | 1.8°F  1.8°F warmer than all-time average temperature. 1.8°F warmer than all-time average temperature. |
| June | 78.7°F | 79.3°F (2025) | 0.6°F  0.6°F warmer than all-time average temperature. 0.6°F warmer than all-time average temperature. |
| July | 83.8°F | 80.8°F (2025) | 3.0°F  3.0°F colder than all-time average temperature. 3.0°F colder than all-time average temperature. |
| August | 81.7°F | 81.8°F (2025) | 0.1°F  0.1°F warmer than all-time average temperature. 0.1°F warmer than all-time average temperature. |
| September | 75.5°F | 76.6°F (2025) | 1.1°F  1.1°F warmer than all-time average temperature. 1.1°F warmer than all-time average temperature. |
| October | 64.6°F | 63.0°F (2025) | 1.6°F  1.6°F colder than all-time average temperature. 1.6°F colder than all-time average temperature. |
| November | 53.8°F | 62.4°F (2025) | 8.6°F  8.6°F warmer than all-time average temperature. 8.6°F warmer than all-time average temperature. |
| December | 48.1°F | 49.8°F (2024) | 1.7°F  1.7°F warmer than all-time average temperature. 1.7°F warmer than all-time average temperature. |
| Average Annual Temperature - since 2017: 64.7°F | |||
| Average Annual Temperature - past 12 months: 65.5°F | |||
Current Trend: 0.8°F  0.8°F warmer than all-time average temperature. 0.8°F warmer than all-time average temperature. |
|||
| Annual Rainfall Trend | |||
| Month | Average since 2017 | Current Month | Difference |
| January | 1.07 inches | 0.23 inches (2025) | 0.84 inches  0.84 inches less than all-time average rainfall. 0.84 inches less than all-time average rainfall. |
| February | 1.11 inches | 1.91 inches (2025) | 0.80 inches  0.80 inches more than all-time average rainfall. 0.80 inches more than all-time average rainfall. |
| March | 1.57 inches | 3.46 inches (2025) | 1.89 inches  1.89 inches more than all-time average rainfall. 1.89 inches more than all-time average rainfall. |
| April | 0.75 inches | 0.10 inches (2025) | 0.65 inches  0.65 inches less than all-time average rainfall. 0.65 inches less than all-time average rainfall. |
| May | 0.25 inches | 0.02 inches (2025) | 0.23 inches  0.23 inches less than all-time average rainfall. 0.23 inches less than all-time average rainfall. |
| June | 0.02 inches | 0.00 inches (2025) | 0.02 inches  0.02 inches less than all-time average rainfall. 0.02 inches less than all-time average rainfall. |
| July | 0.01 inches | 0.00 inches (2025) | 0.01 inches  0.01 inches less than all-time average rainfall. 0.01 inches less than all-time average rainfall. |
| August | 0.05 inches | 0.10 inches (2025) | 0.05 inches  0.05 inches more than all-time average rainfall. 0.05 inches more than all-time average rainfall. |
| September | 0.05 inches | 0.46 inches (2025) | 0.41 inches  0.41 inches more than all-time average rainfall. 0.41 inches more than all-time average rainfall. |
| October | 0.41 inches | 2.45 inches (2025) | 2.04 inches  2.04 inches more than all-time average rainfall. 2.04 inches more than all-time average rainfall. |
| November | 0.66 inches | 0.00 inches (2025) | 0.66 inches  0.66 inches less than all-time average rainfall. 0.66 inches less than all-time average rainfall. |
| December | 1.66 inches | 1.11 inches (2024) | 0.55 inches  0.55 inches less than all-time average rainfall. 0.55 inches less than all-time average rainfall. |
| Average Annual Rainfall - since 2017: 7.61 inches | |||
| Average Annual Rainfall - past 12 months: 9.84 inches | |||
Current Trend: 2.23 inches  2.23 inches more than all-time average rainfall. 2.23 inches more than all-time average rainfall. |
|||
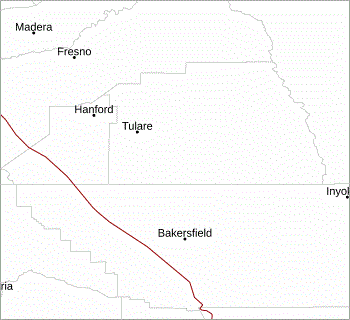
Information shown is based on data collected from two weather stations installed at a private residence located in Exeter, California. These are not official data.
Annual trends script courtesy of Wildwood Weather.


