Air Quality

Park Place, Exeter, California
Updated: Saturday, December 6 2025 - 7:31 PM PST
|
Real-Time Air Quality Map |
||||||||||||
|
||||||||||||
Sensor A |
||||||||||||
|
||||||||||||
| Sensor B | ||||||||||||
|
||||||||||||
|
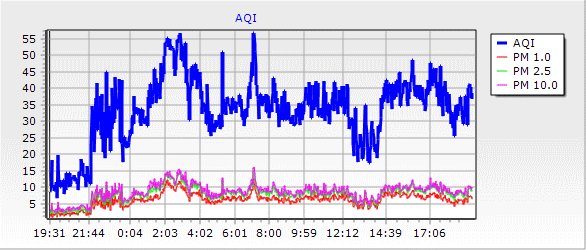
The main number shown above is the current air quality index for PM2.5 (fine particulate matter). The AQI is derived from the short-term (10 minute average) values. The PurpleAir device contains two particle detectors to provide redundancy and help determine sensor health. |
Real-time PurpleAir script courtesy of Saratoga Weather.
AQI chart generated by Weather Display software.
Porterville, California
Updated: Saturday, December 6 2025 - 7:30 PM PST
Ozone (O3), in parts per billion (ppb)
Updated: Saturday, December 6 2025 - 7:30 PM PST
Ozone (O3), in parts per billion (ppb)
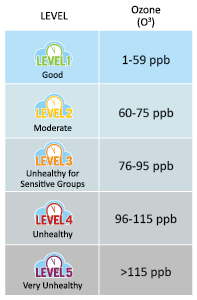
| Pollutant Type | Air Quality Level | Latest Concentration |
| Ozone | Good | 12 ppb  |
|
|
